
 Manufacturing
 Learn more about our services
 Learn more about our process
In part one of this two-part blog series, we introduced how Salesforce Event Monitoring and Splunk were used to deep-dive into an enterprise-scale Salesforce org and uncover unavailable insights via traditional means. Like many long-standing Salesforce instances, this org had a significant technical debt that led to user-impacting errors and performance issues that were difficult to quantify or pinpoint root causes.
Through Salesforce Event Monitoring, we unearth the most problematic issues and use the data we find to drive the necessary improvements. In part two, we transitioned from the investigation phase to a strategy of proactivity instead of reactivity, where we can outline parameters for what is considered “normal” or “healthy” for the org and put in place proactive measures to ensure its continued stability.
Salesforce Event Monitoring: Proactively Monitor
What if our admins and developers could be notified of problems before users tell us about them – especially intermittent or hard-to-reproduce issues?

We set out to solve this problem using Splunk’s alerting capabilities combined with Salesforce Event Monitoring. Here’s how we did it:
1. Determine the Baseline
The first step is to determine what would be considered normal or healthy metrics for the org to accurately determine what is abnormal. For example, if our org averages 100k transactions per day, it’s safe to assume that if it fluctuates between 80k and 120k transactions that wouldn’t be a big deal. But what if one day we see 200k transactions in a day? That’s odd: it’s double our average transaction volume.
2. Define the Alerts
With alerts, you can set a threshold for transactions that would be outside the realm of normal, and get notified quickly when that threshold is reached. This idea is true of any process in an org, not just total transaction count. Essentially, a saved Splunk query that gets run periodically and checked against a threshold value.
We determine what is expected for every significant error process in our client’s org, then implemented an alert to track the process and get notifications if it spikes.
Here is a short list of sample alerts we created:
- 500 Long Running Transactions in the last hour
- Bulk API Batch Limit Exceeded (>=15k in the last 24hrs)
- 100 Row Lock Errors in the last hour
- Login Rate Exceeded Exception (a single user attempting to log in at least 3,600 times in an hour)
- Login Attempt from an Inactive User
- 10 Null Pointer Exceptions in the last hour
- A User had >=2.5k Transactions in the last hour
3. Tell Somebody
Now, something will happen when the threshold is reached. But then what? Send an email? A text message? Run a script? All of these are possible, but we chose to integrate with Slack and send a short note to a Slack channel that included their lead Salesforce admins and developers.
Here is an example of what an actual message can look like:
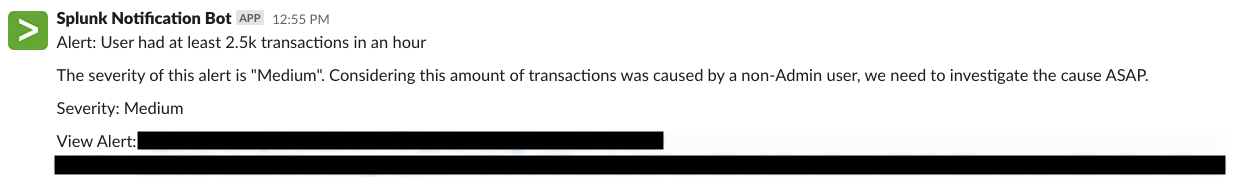
When such an alert is triggered, someone from the team can dig deeper into the underlying issue and escalate as needed – perhaps follow up with the end-user pre-emptively or inform the help desk that an investigation is already underway.
Solving Problems Before Users Even Notice

Alerts allowed us to be proactive instead of reactive, and gave a level of visibility into the org that was previously impossible. We had the dashboards, reports, and visualizations to explain what was happening, but alerts took that visibility to another level. It’s the difference between being able to explain an incident after it happened versus being notified early enough so that it doesn’t escalate in the first place.
Sometimes you don’t even know an issue is brewing, but something sinister lurks beneath the surface. We received an alert notification that a single user had crossed the threshold for transactions in an hour. They had generated over 500k events in an hour and somehow executed 4.2 million Apex transactions in less than a day! This was highly abnormal, accounting for over 40% of total transactions in the org that day – and this was a regular Sales user!
From the alert notification, we could identify this transaction spike early and dive deep to pinpoint the root cause – a read-only Lightning component on a record detail page (from a popular Managed Package app) had somehow triggered an infinite loop and was constantly calling its server-side controller non-stop. The logs provided helped the ISV vendor fix this previously unknown bug in their app, as we pinpoint the cause and give the evidence their development team needed.
Another real-world example was when a specific user had triggered a LOGIN_RATE_EXCEEDED error outside of business hours. This error indicates a single user had at least 3,600 login requests in an hour, and Salesforce automatically locks their account as a precaution. Our user hadn’t attempted 3,600 logins, but over 60,000! Clearly, this was an automated process malfunctioning or an attempted security breach. An alert notified us of this issue before the user’s account was locked, and we were able to thoroughly investigate with detailed log files at our fingertips and take corrective action before the user realized their account was locked the next morning.
Going Real-Time?
Salesforce offers additional Real-Time Event Monitoring capabilities that allow streams of key Event types, sent in real-time, into Splunk or another tool of your choice. This feature allows for time-sensitive events to be analyzed as they happen rather than after the fact (or on an hourly or daily basis). We’d highly recommend looking into this feature further as part of your Event Monitoring deployment.
Next Steps
Want to be Proactive instead of Reactive? Do you wish you had a guardian angel that could tell you when something is about to go wrong? Reach out to us and we can help your organization as you embark on your journey with Event Monitoring. Don’t forget to check out the Trailhead to learn more.